Changing the Display Range
The Display Range feature allows you to improve the visualization of objects of interest in your images by:
-
Excluding irrelevant image data
-
Boosting the contrast between relevant intensities.
Often the actual useful data in an image does not cover very much of the possible range of intensity values. For example, intensity values of an 8-bit grayscale image can range from zero to 255, and often the useful data covers only a small portion of that range.
With the Display Range feature, you can set high and low thresholds for intensity values such that all pixel intensities below the low level display as black and all pixel intensities above the high level display as white. The high value is called the "white level," or "WL." The low value is called the "black level," or "BL." The WL and BL define the display range for the image. Once a display range is defined, Image-Pro scales the intensities within the display range to the full range of intensities for the image. This has the effect of increasing the contrast between intensities within the display range.
Note: When images are initially opened in Image-Pro,
the default Best-Fit display
range is automatically applied to them. The
instructions in this section explain how to modify the display range settings.
Note: Display range enhancements are implemented through a Lookup Table rather than by modifying the image bitmap. The original appearance of your image can be restored at any time. See Resetting the Image and Making Enhancements Permanent for more information.
There are several ways to adjust the display range. You can:
-
Type over the BL and WL values in the Display group on the Adjust ribbon. Click here for more information.
-
Change the Best-Fit display range options and re-calculate the best-fit display range. Click here for more information.
-
Adjust the WL and BL markers through the Image Histogram or Advance Display panel. Read below for more information.
To change the display range for an image using the WL and BL markers:
Open the Image Histogram (click the Image Histogram tool on the Capture ribbon).
The Image Histogram is opened.
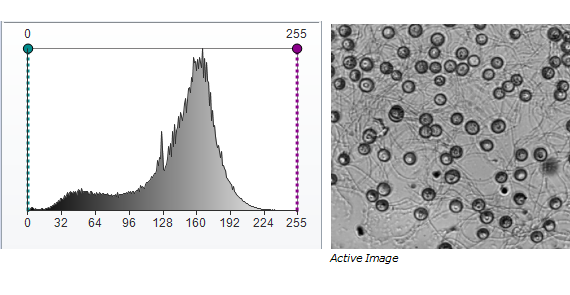
This histogram is a graph of the intensity values
of the active image. The x-axis represents all possible intensity values
(for example, 0-255 for an 8-bit image), and the y-axis represents how
often any given intensity value occurs in the image. Two
vertical markers show the upper and lower limits of the intensity levels.
These limit markers can be moved with your cursor. To
move a vertical marker, position the cursor over it and, when the Move
cursor [ ] appears, drag it to the right or left.
Note: For color images, the markers set the intensity threshold for all colors; you cannot set different thresholds for different color channels.
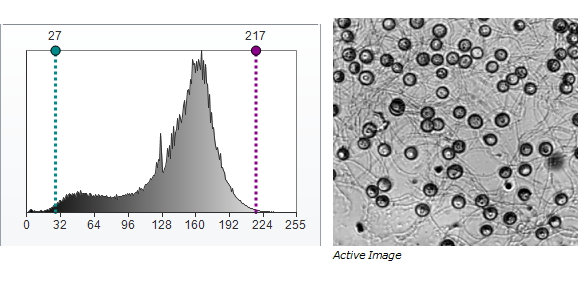
Adjust the upper and lower vertical markers to define the desired range of interest.
For example, the following shows how the markers have been adjusted to highlight the range where intensity values are most represented.